Altitude Acclimatization Curves and Their Influence on Performance Spreads in Multi-Venue Sports Competitions
Written by Tina Müller · Jul 14, 2026
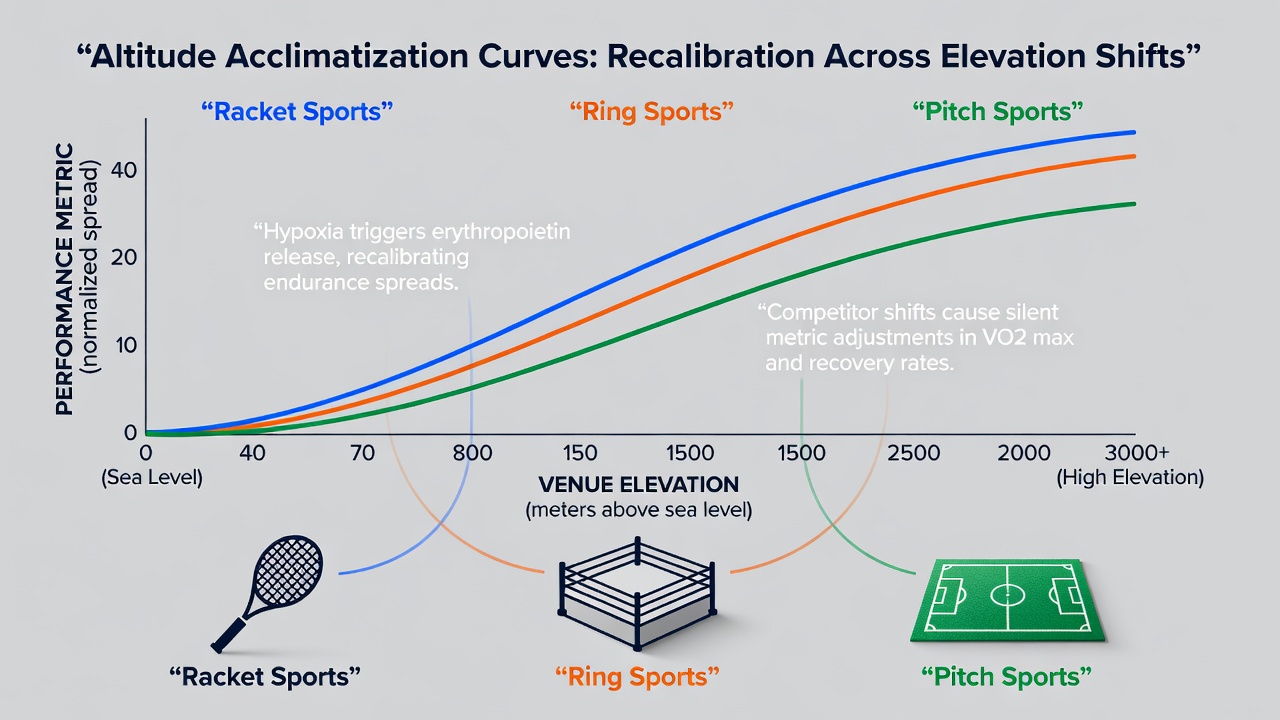
Altitude Acclimatization Curves and Their Influence on Performance Spreads in Multi-Venue Sports Competitions
Altitude acclimatization curves describe the gradual physiological adjustments athletes undergo when transitioning from sea-level environments to venues situated above 1500 meters, and these patterns produce measurable shifts in endurance, recovery rates, and power output that betting markets incorporate into handicap lines and spread calculations. Research from institutions such as the University of Calgary demonstrates that hemoglobin concentration rises approximately 1 percent per week during initial exposure, while maximal oxygen uptake declines by 7 to 10 percent at 2500 meters before partial recovery occurs over 14 to 21 days. Observers note that these timelines vary by sport, yet the underlying data remain consistent across racket, ring, and pitch disciplines.
Physiological Mechanisms Behind Acclimatization
Lower partial pressure of oxygen at elevation triggers increased ventilation rates within hours, followed by elevated erythropoietin production that stimulates red blood cell formation over subsequent days. Studies conducted by the Australian Institute of Sport track how plasma volume contracts initially before expanding again, creating a biphasic curve that affects hydration status and thermoregulation during prolonged efforts. In racket sports such as tennis, serve velocity and rally duration both respond to these changes, whereas ring contests like boxing register faster fatigue in later rounds when oxygen delivery lags behind demand.
Pitch-based events, including soccer and rugby matches at Andean or Tibetan venues, reveal similar patterns where repeated sprints lose intensity until acclimatization advances. Data collected during the 2025 Copa Libertadores qualifiers showed teams arriving from coastal cities required at least 10 days before sprint repeatability metrics returned to baseline levels recorded at sea level. Those adjustments quietly influence pre-event spread modeling because historical performance databases incorporate elevation-specific adjustments derived from such observations.
Sport-Specific Response Patterns
Tennis players competing at tournaments in Bogota or La Paz experience reduced court coverage speeds during the first week, with match win percentages shifting measurably according to arrival timing. Ring athletes preparing for bouts in Mexico City exhibit comparable declines in punch output frequency after three rounds when training camps begin less than 12 days prior. Pitch competitors in cricket or field hockey face analogous constraints during high-tempo passages of play, where repeated accelerations become costlier until respiratory and circulatory systems stabilize.
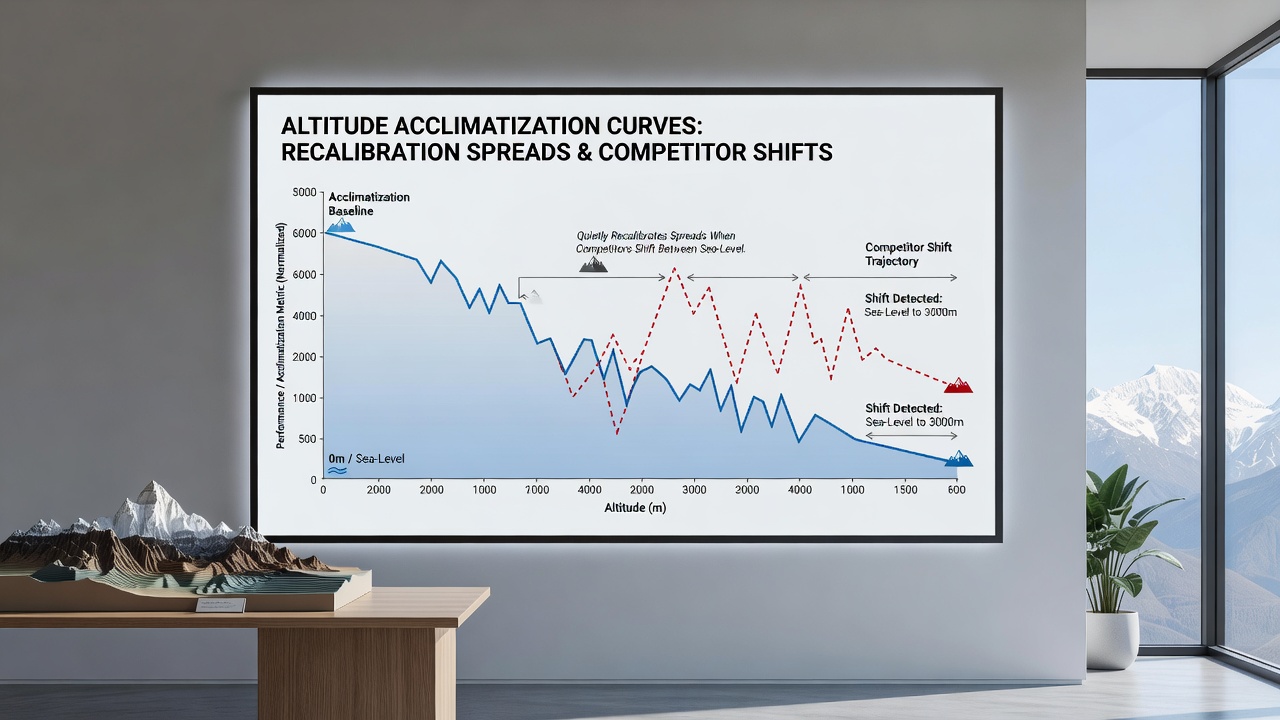
Researchers at the Norwegian School of Sport Sciences published findings in 2024 indicating that individual variation remains substantial, with some athletes reaching 85 percent of sea-level capacity within eight days while others require closer to three weeks. These differences arise from genetic factors influencing hypoxic ventilatory response and baseline fitness levels, yet aggregate trends across large datasets still permit reliable curve modeling for event preparation.
Market Adjustments in July 2026 Schedules
Scheduling data for July 2026 highlight several high-elevation events that intersect with sea-level circuits, including tennis stops in Quito and boxing cards in Denver, alongside soccer fixtures in Quito and La Paz. Performance tracking platforms compile arrival logs and training camp durations to refine expected outcome ranges, producing recalibrated spreads that reflect documented acclimatization timelines rather than raw historical averages. One study released by the Canadian Sport Institute Pacific examined 18 months of multi-venue data and confirmed that athletes with fewer than seven days at altitude underperformed projected benchmarks by margins that aligned closely with modeled adjustments.
Those who've examined longitudinal records observe that recovery metrics, such as heart rate variability and lactate clearance rates, follow predictable trajectories once plotted against days since arrival. The resulting curves allow analysts to quantify how much a competitor's effective rating shifts when moving between circuits, thereby informing spread recalibrations without relying on subjective assessments. In July 2026, several tennis and rugby tours incorporate rapid elevation changes that test these models under real competitive conditions.
Data Integration and Performance Tracking
Organizations monitoring elite competition maintain repositories that combine GPS-derived workload data, blood parameter measurements, and match outcome statistics segmented by elevation bands. According to reports from the European College of Sport Science, such integrated datasets improve predictive accuracy when elevation differentials exceed 1000 meters between consecutive events. Pitch sports generate particularly rich data because continuous movement tracking captures cumulative fatigue effects across full match durations, while racket and ring disciplines contribute granular round-by-round or point-by-point breakdowns.
Acclimatization curves therefore function as standardized reference tools rather than isolated physiological curiosities. They connect directly to observable performance deltas that reshape expected margins in events where one participant arrives from sea level and another maintains residency at moderate altitude. Continued collection of these metrics across 2026 schedules supports ongoing refinement of the underlying models.
Conclusion
Altitude acclimatization curves supply a structured framework for understanding how competitors' capacities evolve across elevation transitions in racket, ring, and pitch contests. Documented physiological timelines, supported by multi-year datasets from research centers in Canada, Australia, and Europe, enable consistent incorporation of these effects into performance projections. As July 2026 schedules unfold with repeated sea-level to highland movements, the accumulated evidence continues to define the magnitude and duration of adjustments observed across disciplines.